A DevTools-class analyzer, that keeps the evidence.
One searchable event table for every signal a tab produces, HTTP, WebSockets, Server-Sent Events and the JavaScript console, backed by two summary grids when you need the bird's-eye view. Filter by kind or status, search full text, pause without losing data, then export only the rows you actually need.
All features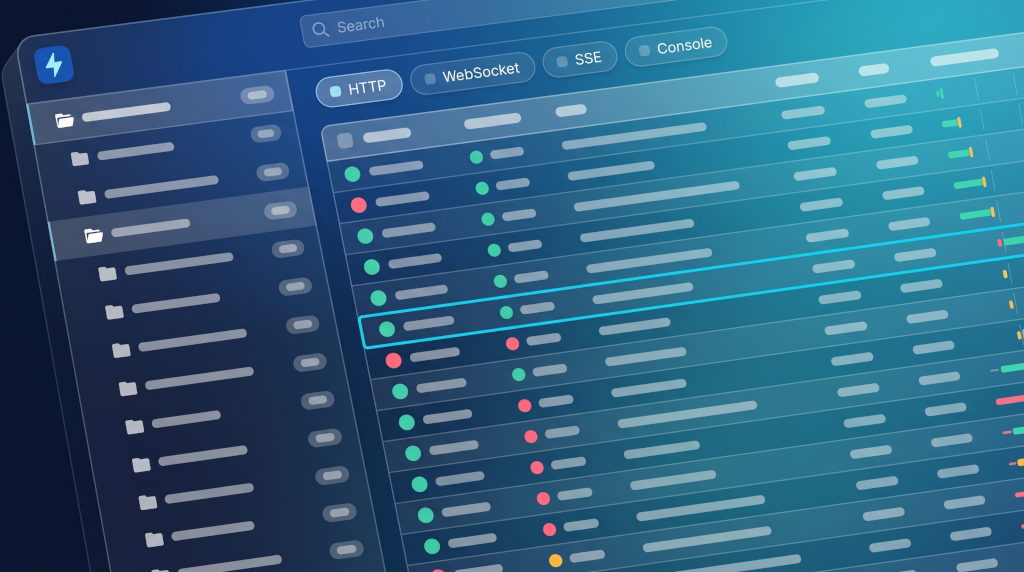
Drill down the way debugging actually works.
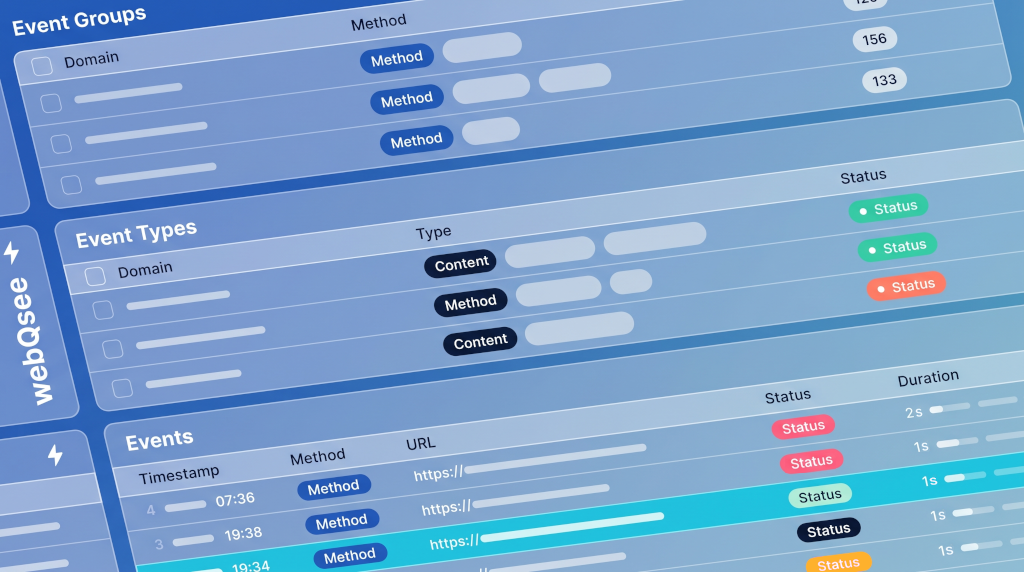
The events table is where you live. Behind it, a separate Groups & Types view answers "what is this page even talking to?" without making you scroll a thousand rows to find out.
Events table
The raw events themselves: HTTP requests, WebSocket frames, SSE messages and console lines, interleaved on a single timeline, with a full-text search box, quick-filter chips (Errors, Warnings, Network, Console, WS, SSE) and a live result counter above it.
Event Groups grid
One row per domain + HTTP method combination, plus dedicated rows for console output, WebSocket connections and Server-Sent Events. Counts and timing summaries at a glance.
Event Types grid
Within a group, drill into one row per type + status, for HTTP that means the MIME type as default discriminator (JSON, JS, image, etc.) paired with the response code.
Pause without losing a frame.
Hitting Pause freezes the grid view so you can read what's in front of you, but capture keeps running in the background. Unpause and the missed events flow in. No more "wait, let me reload and try again".
- Multi-column sort. Shift+click column headers to chain sort criteria, order by status, then by duration, then by URL.
- Per-row filters. Type into a column's filter input to narrow the visible set. Filters compose across columns.
- Keyboard arrow navigation. Move row-by-row with up/down arrows; details pane updates instantly.
- Pause that doesn't drop data. The grid stops updating; the capture engine doesn't.
- Live event counts. Top-bar counters tell you how many events have been captured and how many match your current filter.
What gets captured
- HTTP, full request and response with headers, payloads and timing
- WebSockets, every frame in both directions with size and timestamp
- Server-Sent Events, every
data:chunk on every EventSource - Console,
log,info,warn,error,debug, plus uncaught exceptions and unhandled rejections - Stack traces, captured with the originating call site for console output
Copy as cURL, and the request is already reproduced.
Select a request and the details dock into the pane above the table, so you can read them without losing sight of where you were. Headers, payload, response, cookies and a timing waterfall, each section with its own copy button, and the copy takes the full body rather than the truncated preview.
The two buttons that matter most: Copy as cURL and Copy as fetch. One click and the exact request, headers and body included, is on your clipboard ready to paste into a terminal, a console or a test.
Per request
- Request and response headers
- Query string, form data and raw payload
- Response body with a line-wrap toggle and a download button
- Cookies sent and received
- Timing breakdown as a waterfall
- Copy as cURL, copy as
fetch()
Logged objects stay objects.
A console line in webQsee is not a flattened string. Each logged argument gets its own card, objects and arrays stay expandable, and the call stack sits underneath in a collapsible block. Level badge and source file on the left, copy buttons for the message, the arguments and the stack on the right.
Uncaught exceptions and unhandled promise rejections are captured alongside the ordinary log, info, warn, error and debug calls, so nothing that reached the console is missing from the record.
Highlight what matters
Any event in the table can be highlighted with a note attached. Highlights are stored with the capture, carry the name of whoever added them, and travel with the item when you share it.
So the recipient does not open a two-thousand-row capture and wonder where to look. More on highlights and triage.
Alt+A. That's it.
The analyzer window opens with a single shortcut next to the tab you're inspecting. Dock it to the browser's side panel, undock it into its own window, your choice. Captures live in the browser's IndexedDB so the window can close and reopen without losing context, and webQsee asks before any action that would throw a running capture away.
All three are remappable on your browser's extension-shortcuts page.
Stop guessing. Start webQseeing.
Add webQsee to Chrome or Edge in one click. Most features are free, forever, no signup needed. Upgrade only if your team needs cloud sharing, S3 storage and Pro-grade tooling.
Works in Chrome 103+, Edge 103+ and most Chromium-based browsers. Install instructions.