Deep Inspection: the agent that asks its own questions
The quick analysis reads an excerpt someone chose for it. Deep Inspection gets the whole recording and decides for itself what to look at next, which is what it takes to answer "why" rather than "what".
Estimated time: 25 min · Last reviewed: 2026-09 · Difficulty: Medium
Available now in the browser, and in the extension this autumn.
The AI analysis, the three webQsee AI strengths, Deep Inspection and the new plans are live today in webQsee web at view.webqsee.com: open a recording there, analyse it, and buy a plan or a booster if you want one. The Chrome and Edge extensions are in review and follow this autumn. Your recordings, your gallery and your account are the same in both, so nothing you do now has to be done again.
Before you start
- A Pro plan, or any BYO AI booster while it lasts. Deep Inspection is the one AI variant a free plan does not include on its own; the quick analysis is
- The webQsee helper installed, and
wqs-helper doctorhappy - An agent on your machine that the helper can start. Claude Code is the built-in profile; any command-line agent can be configured
- One recording in your gallery
- Optional but worth it: the source code of the application you recorded, checked out locally
What is different about it
The recording is handed to the helper once, and from then on the agent reads it through a set of tools rather than being sent a fixed excerpt. It can list events, filter them, open one in full, search inside response bodies, pull the video frame at a given moment, and ask what happened around a request. It follows what it finds.
Two consequences worth knowing before you start. It is slower and it costs more, because it makes many calls rather than one. And it runs on your machine, so whether anything reaches a cloud model is decided by the agent you configured, not by webQsee.
Choose the agent, and where the conversation happens
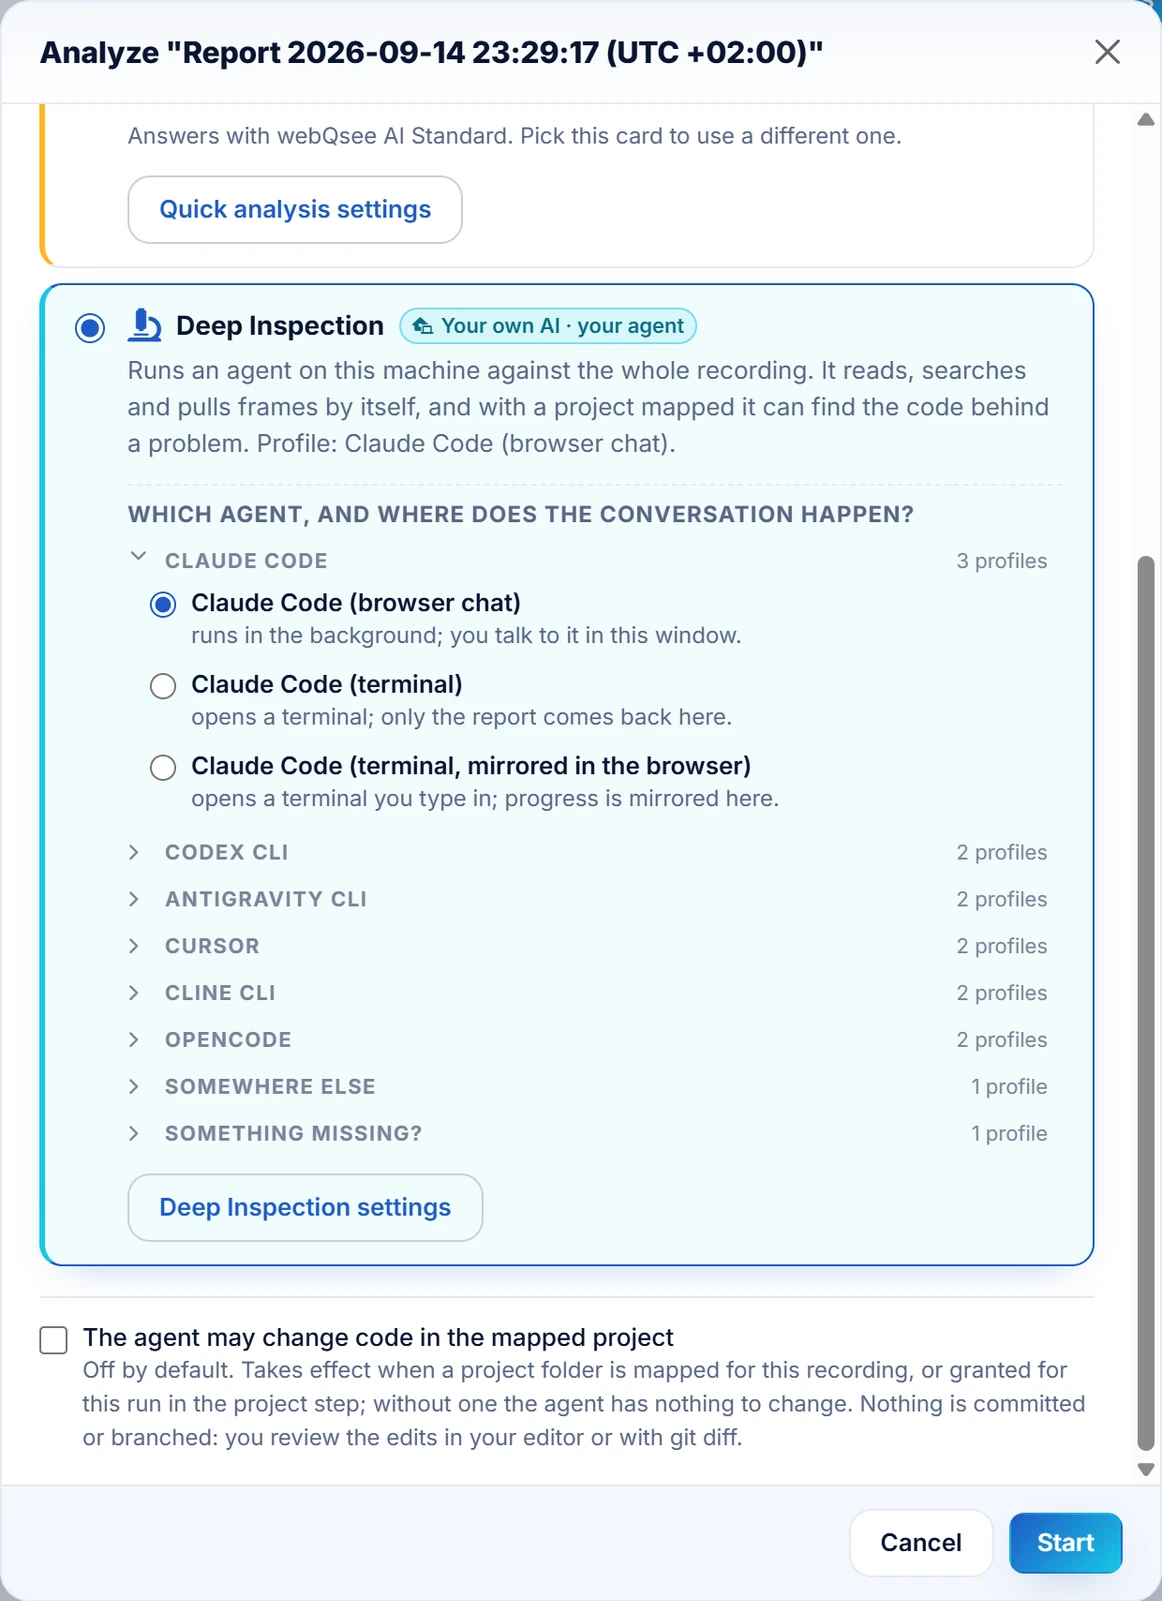
Selecting the Deep Inspection card opens one row inside it: Which agent, and where does the conversation happen? It is a single question because the answer is a single setting. The list is grouped by vendor, one group per CLI you have, each collapsed to a line that says how many profiles are under it, so six agents with three profiles each stay a list you can read rather than eighteen radio buttons. Open the one you want and pick a profile. The three below are what those profiles are, and all three run the same agent on the same recording.
In this window
The agent runs invisibly and its progress and answer stream into the panel. Nothing to switch to.
Start here.
In a terminal, mirrored here
A real terminal opens with the agent already primed on this recording. Type follow-ups there, and what it says also appears in the browser.
For when you want the agent's full output.
In a terminal only
The same, without the mirror. The browser hands the recording over and steps out of the way.
For when you are going to stay in the terminal anyway.
Run one
Press Analyze, pick Deep Inspection, pick "in this window"
If Deep Inspection is greyed out, the card says why: the helper is not reachable, or, in a browser tab, Deep Inspection is not set up yet, or your browser has not allowed (or is blocking) the page reaching the helper. It says so on the card itself rather than letting you press it and wait.
Sanity check: the sheet's status line reads "The webQsee helper is running" with a version number.Ask the first question
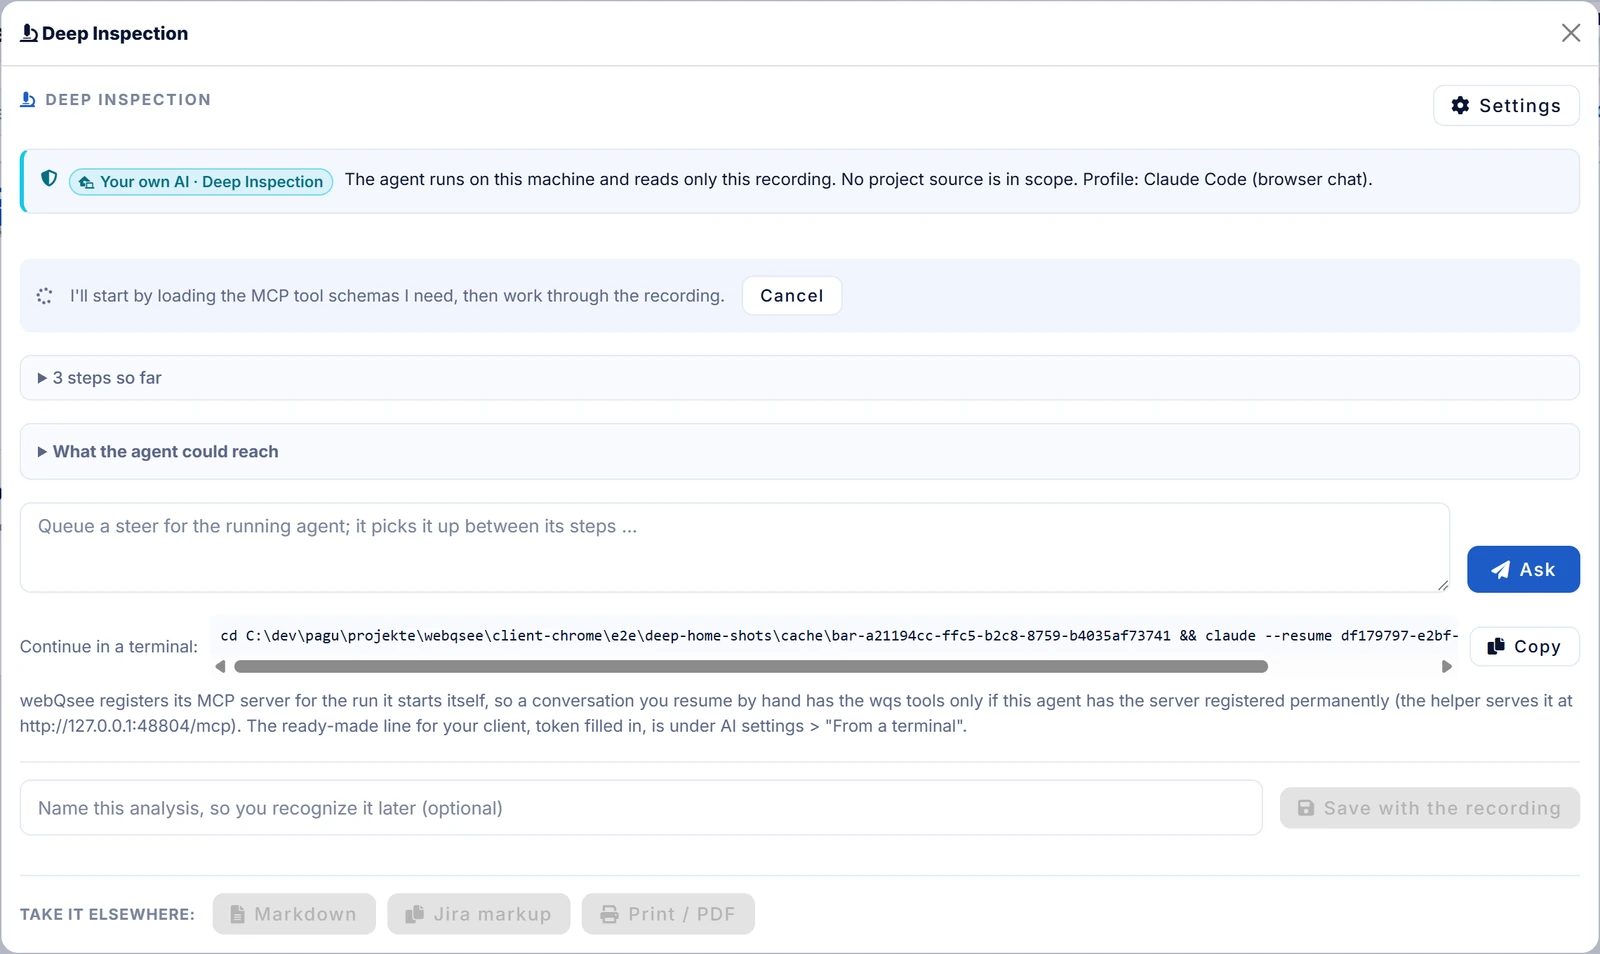
Nothing is transferred until you do. Opening the panel costs nothing: the recording is handed over when the first question is asked, which is also when you will see the progress line move through preparing, sending and reading.
Sanity check: the panel shows the agent's steps appearing one by one, not just a spinner.Close the tab if you want to
The analysis keeps running. The agent is a detached process on your machine, not something owned by the browser tab, and when you come back to the recording the panel offers to pick the conversation up rather than starting a second one.
Sanity check: reopen the recording and press Analyze. You are asked whether to carry on the earlier analysis, and choosing that shows the answer that was produced while nothing was watching.Push on the answer
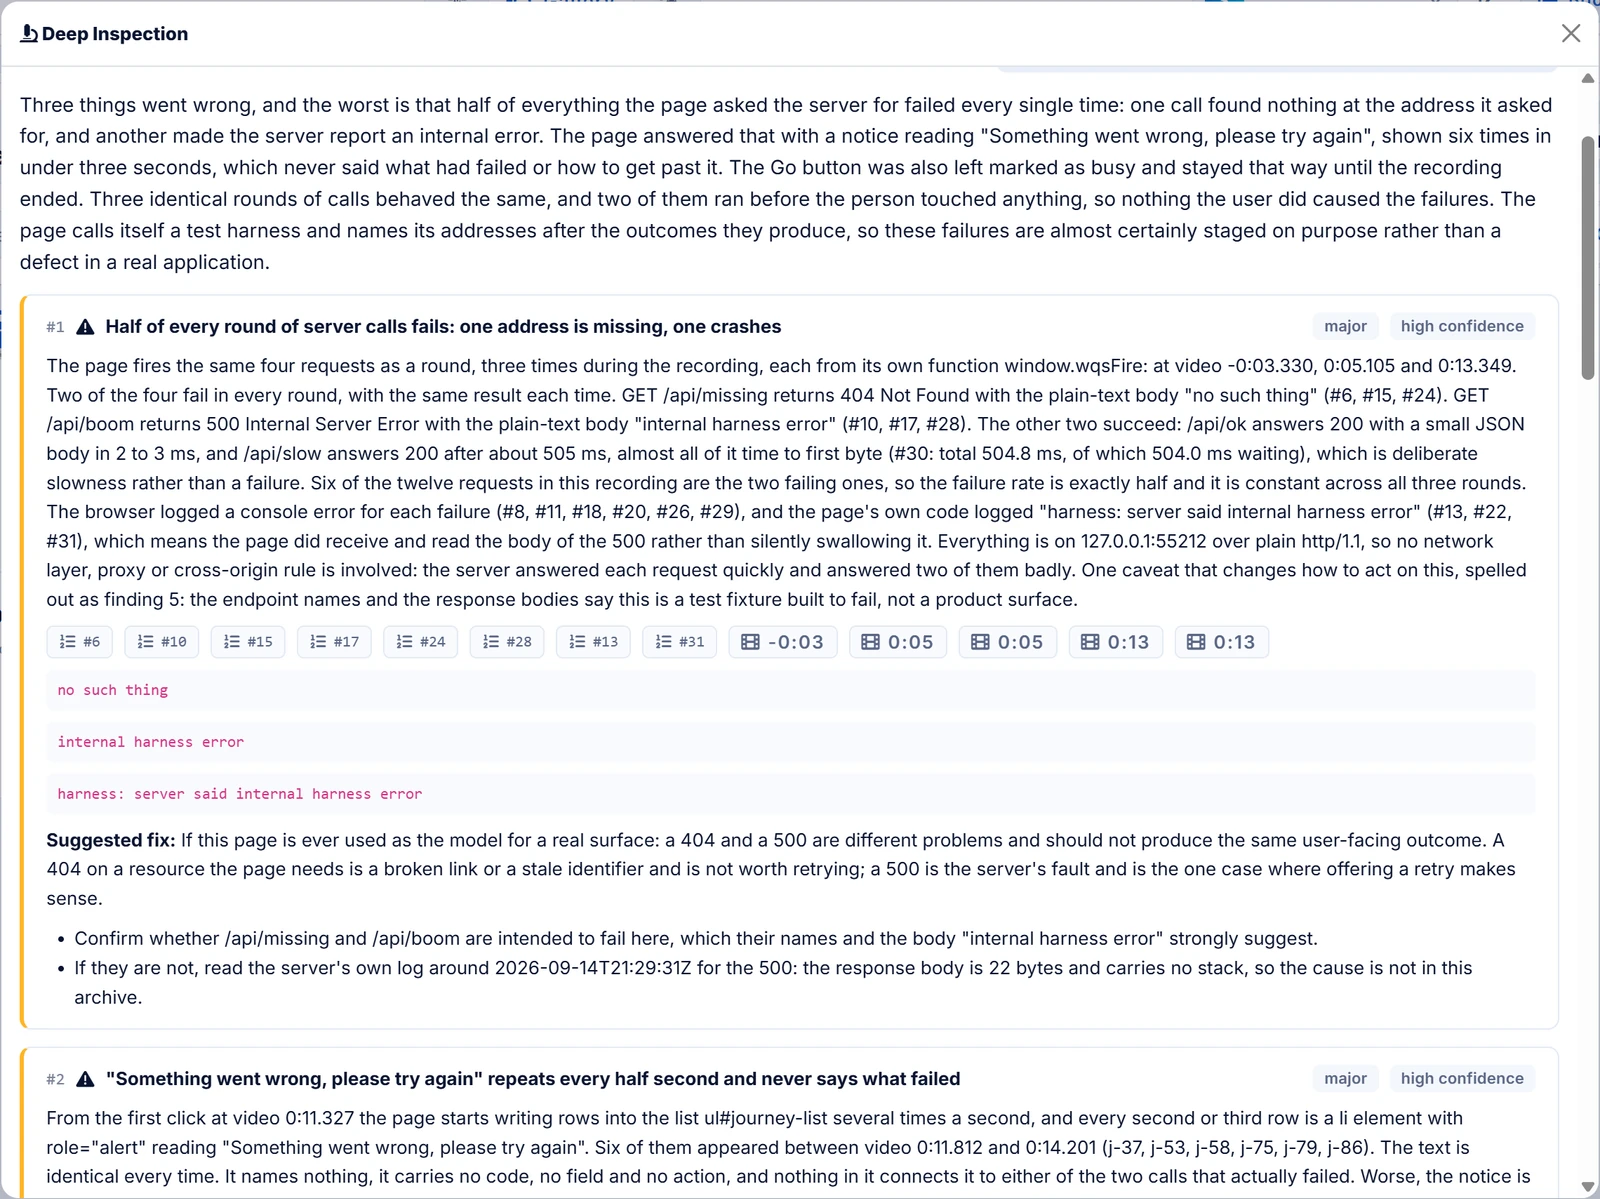
The conversation stays open and the agent still has the recording. Follow-ups are where Deep Inspection earns its cost:
"Was that 500 the first one, or had it been failing before the recording started?"
Sanity check: the second answer cites different rows than the first. If it cites the same ones, the question was probably a rephrasing rather than a new one.Or carry on in your own terminal
Under the conversation, Continue in a terminal has a line to copy, and the sessions list in the AI Analysis settings has the same one per conversation:
wqs-helper continue <session>It opens the same conversation with the same agent, in the folder it ran in, and switches the webQsee tools on for it, with a token for that conversation that is revoked when you leave it. Cursor and Antigravity are the exception: their CLIs take MCP servers only from their own global configuration, so there the tools are available only if you registered the helper with them once.
Sanity check: ask the continued conversation to list its tools. The webQsee ones, such asget_overview, are there (with Cursor and Antigravity, once you have registered the helper with them). Resuming with the agent's own command instead (claude --resumeand the like) starts it without them, and an agent without them tends to report that the recording does not exist.
Let it read your code
This is where most of the value is. The recording says what happened; the source says why. Map the application's origin to a checkout on your machine and the agent can open the file behind the request it is looking at.
Map an origin to a directory
In the extension's analysis settings, add a project mapping: the origin of the site you record, and the local directory of its source. Wildcards are allowed in the host part, for example
https://*.example.com.Sanity check: start an analysis of a recording of that site. The destination line above the question box now names the project instead of saying no project source is in scope.Decide whether it may change code
Reading is the default. Writing is a separate, explicit choice per analysis, and it is only ever possible when a project is mapped in the first place.
Sanity check: with fix mode off, the agent proposes a change in prose. With it on, it can edit the file, and the panel says so before you start. Either way nothing is committed, branched or backed up: review the edits in your editor or withgit diff, as you would after any coding agent.
A whole collection at a time
Select several items, or open a collection, and analyze them together. The agent can then answer the question that is actually being asked most of the time: what is different between the run that works and the run that does not. See comparing two recordings.
Everything in the collection goes to the agent, not only the recordings. It looks at the screenshots, reads the Excel events overview as a table, and reads an HTTP archive as the event snapshot it would become on import, so it can compare that one too. The collection's description and notes go along as context. The analysis is then saved on the collection itself, together with a record of what the collection contained at that moment; if items are added or removed later, the saved analysis says so.
Your own files, with a question
The agent reads the recording by itself, but some things only you have: the spec, the server log, the screenshot a customer mailed. Attach them to a question with the paperclip, drop them onto the question box, or paste a long log, which becomes an attached text file the way it does in a chat app. They go to the webQsee helper on your machine for that question. webQsee keeps their names and sizes with the analysis and never their content.
Troubleshooting
| What you see | What it usually is |
|---|---|
| Deep Inspection is greyed out | In the extension: the helper is not running or not registered. Run wqs-helper doctor, and restart the browser after a fresh install. In a browser tab: the card names the reason; not set up means pasting the helper's token in the Deep Inspection settings, and a browser that blocks the page is fixed with the Apps on device switch left of the address. |
| The panel opens but nothing happens | Nothing is transferred until the first question. Type one and send it. |
| "the agent could not be started" | The configured command is not on the PATH. wqs-helper doctor names the command it tried and where it looked. |
| A terminal opens and closes immediately | Usually the agent exiting on a bad argument. Run the same analysis in this window instead, or check the helper's log at ~/.wqs/logs/daemon.log. |
| A conversation continued in a terminal says the recording does not exist | It was resumed with the agent's own command, which starts it without the webQsee tools. Use the wqs-helper continue line from the panel or the sessions list, or register the helper with that agent once. |
| The answer says a frame could not be extracted | Frame extraction uses ffmpeg when it is installed. Without it, webQsee hands the helper the frames the browser decoded itself, so a moment before the video starts genuinely has no picture. That is normal for the lead-in. |
Next
Stop guessing. Start webQseeing.
Add webQsee to Chrome or Edge in one click. Recording and replay are free, no signup needed. Upgrade when you need AI analyses, cloud sharing, S3 storage and Pro-grade tooling.
Works in Chrome 103+, Edge 103+ and most Chromium-based browsers. Install instructions.