Ask a recording what went wrong
A webQsee recording already holds the video, the network traffic, the console and the state of every event. The AI analysis reads all of it and answers in your own words, citing the exact rows it based each finding on.
Estimated time: 10 min · Last reviewed: 2026-08 · Difficulty: Easy
Available now in the browser, and in the extension this autumn.
The AI analysis, the three webQsee AI strengths, Deep Inspection and the new plans are live today in webQsee web at view.webqsee.com: open a recording there, analyse it, and buy a plan or a booster if you want one. The Chrome and Edge extensions are in review and follow this autumn. Your recordings, your gallery and your account are the same in both, so nothing you do now has to be done again.
Before you start
- webQsee installed in Chrome or Edge, get it here
- A webQsee account. Your plan includes a number of analyses, and a free account gets ten BYO AI ones once, and five on webQsee AI to claim. The count is kept against the account. See what it costs
- A minute on what the AI analysis is, if you have not read it yet
- One recording in your gallery: a Behavior Report or an Event Snapshot
- For the quick analysis: nothing at all if you use webQsee AI, otherwise an API key for a model provider or a model running on your own machine
- For Deep Inspection: the webQsee helper installed, and either a Pro plan or any BYO AI booster
What it actually reads
Not the raw file. A recording is turned into one canonical model first: every network request with its timing and its body, every console line, the page each event belongs to, the video offset of each moment. The model that answers you sees that, in the same numbering the webQsee analyzer shows on screen. So when a finding says event #214, you can open the analyzer, go to row 214 and look at the same thing it looked at.
That is the part worth understanding before anything else: the analysis cites rows, and the rows are checkable. It is not a summary you have to take on faith.
Two ways to run it
They answer different questions, and the difference is not subtle.
Quick analysis
Sends a budgeted excerpt of the recording straight to a model from the browser. No helper, no agent, one API call, an answer while you are still looking at the recording. It picks the highest-scoring moments, some response bodies and a few video frames, and it says out loud what it had to leave out.
Good for: "what is going on here".
Deep Inspection
Starts an agent on your own machine with the whole recording available. It reads, filters, searches response bodies, pulls the video frames it wants, follows the evidence, and with a project mapped it can read the source code behind the behaviour. Slower and more expensive.
Good for: "why".
Running your first one
Open a recording, or make one
Any recording in the gallery will do. If you have none, record something short: press record, reproduce the problem, stop. The analysis is only as good as what was captured, and the most common disappointment is a recording that starts after the interesting part. If you are chasing something specific, start recording before you trigger it.
Sanity check: the recording appears in your gallery with a thumbnail and an event count above zero.Press Analyze
The action sits on the gallery card, on the gallery row, in the analyzer's toolbar, and in the save dialog straight after a capture. All four open the same thing.
Sanity check: a sheet appears offering Quick analysis and Deep Inspection. If Deep Inspection is greyed out, the card says why: usually the helper is not running (see the helper install guide), or, in a browser tab, Deep Inspection is not set up yet or your browser has not allowed the page to reach it.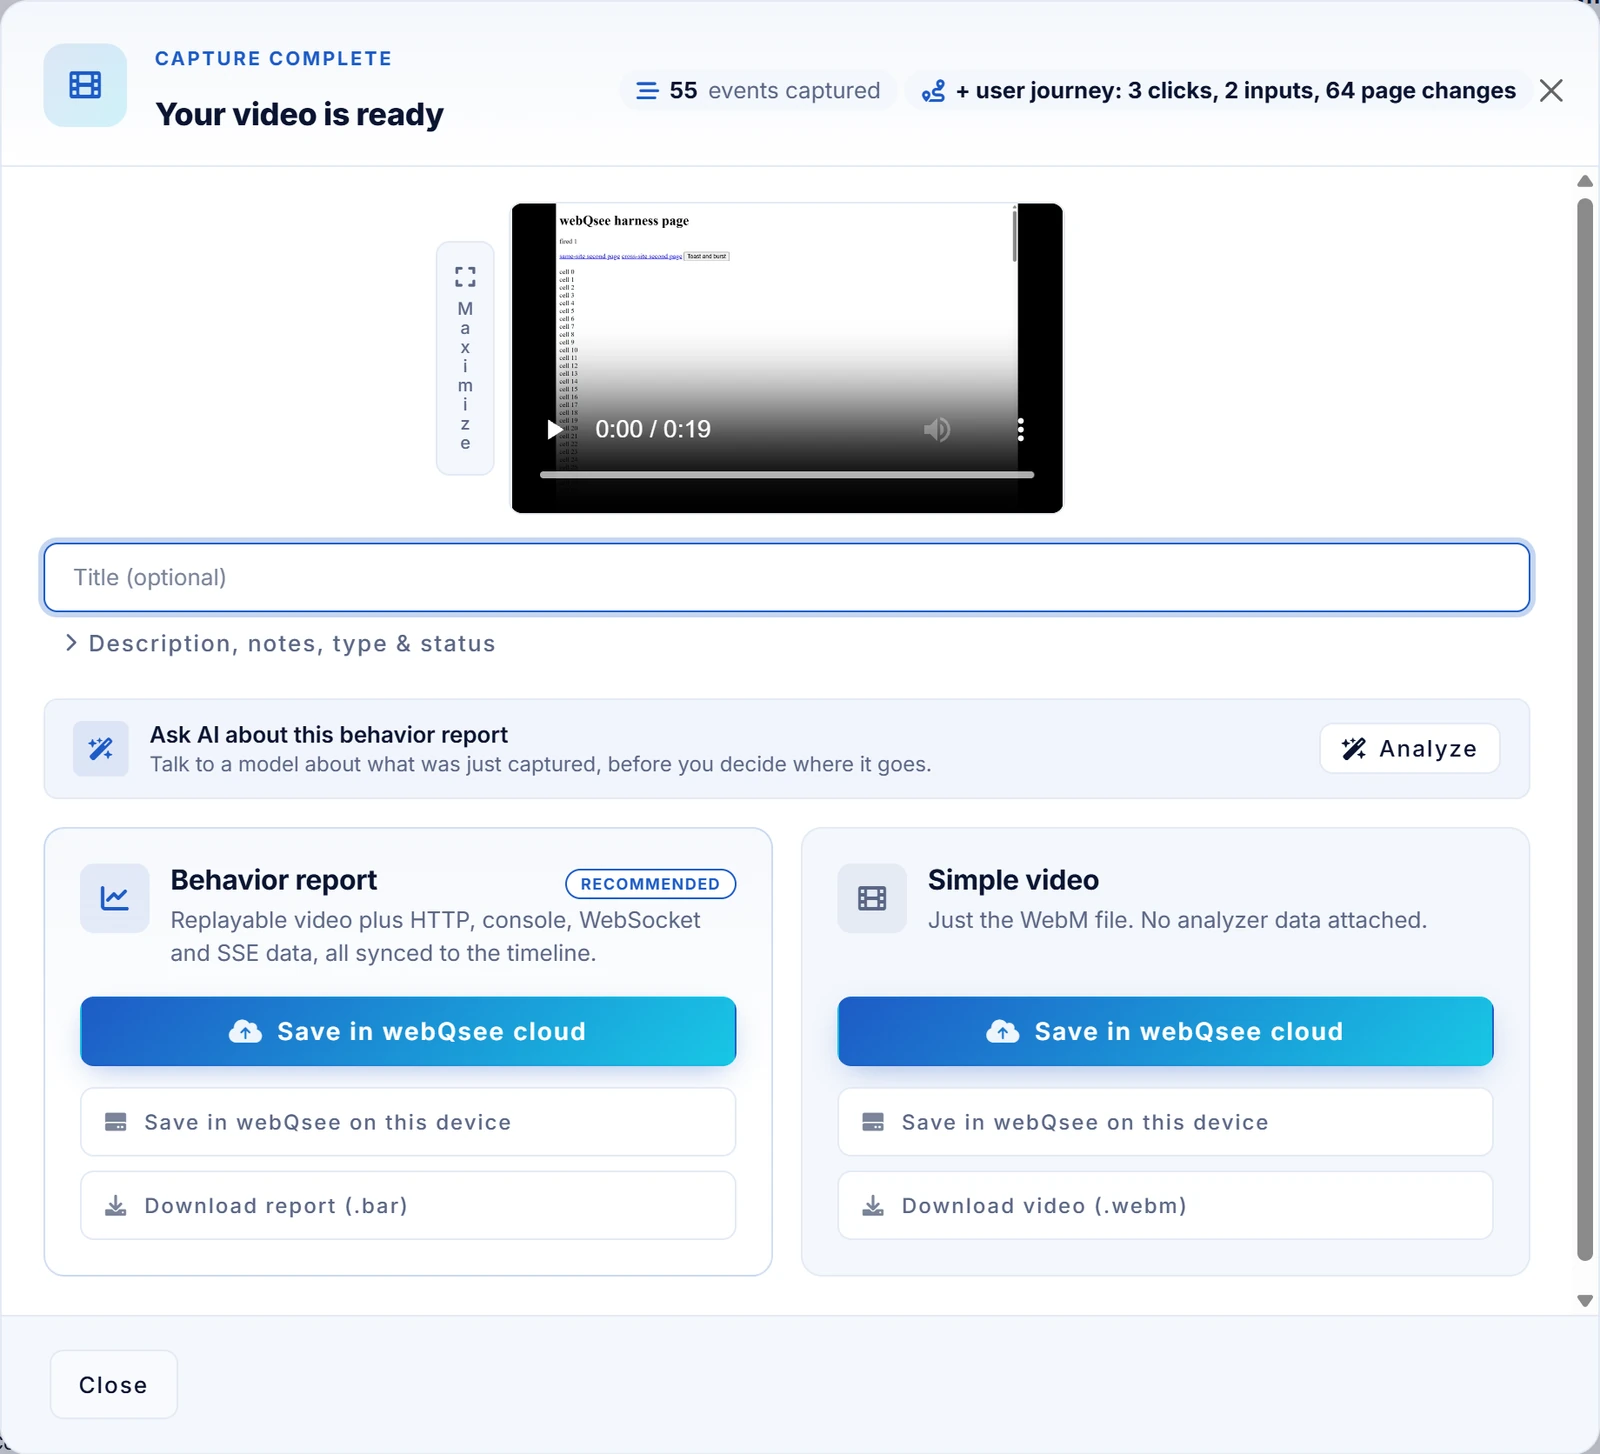
Straight after a capture, before it is saved anywhere. Analyze here and the recording is handed over from memory: no gallery row is needed first. Ask something specific
Vague questions get vague answers. Name the moment and the symptom:
"The Add to cart button did nothing at 0:14. What actually happened?"
Sanity check: the answer comes back as findings, and at least one carries an evidence chip with an event number.Check one finding against the analyzer
Click an evidence chip, or open the analyzer and go to the row it names. This is worth doing once, on purpose, the first time you use the feature: it is how you calibrate how much to trust the rest.
Sanity check: the row the finding cites is the row you expected, and it says what the finding said it says.Keep the analysis with the recording
Press Save with the recording at the bottom of the panel, and give it a name in the field beside it if you want to recognise it later. It is then stored inside the recording, so exporting the recording and sending it to a colleague sends the analysis too, and a shared cloud link shows it. The button waits until the answer is in: there is nothing to keep before that, and the run is not at risk in the meantime, because it carries on without the window and the panel picks it up again.
The same row offers Markdown, Jira markup and Print / PDF under "Take it elsewhere", for the copy that goes into a ticket.
Sanity check: reopen the recording in the report player. The analysis panel lists it, with the conditions it was made under.
What leaves your machine
This is the question worth answering before you run the first one, and the honest answer depends on which variant you use and where you point it.
- Deep Inspection runs on your machine. The recording is handed to a local helper process and to an agent you already have installed. Whether anything reaches a cloud model is decided by which agent you configured, not by webQsee.
- The quick analysis posts to whichever endpoint you configured. Point it at a model running on your own machine and the recording never leaves it. Point it at a cloud provider and the excerpt does.
- Credential masking is on by default for a cloud destination and off for a local one, and it is switchable either way. It masks values, never the names, so "no token was sent" and "a token was sent and rejected" stay distinguishable.
The full picture, including what a shared link exposes, is in what the analysis sends, and where.
Where to go next
Stop guessing. Start webQseeing.
Add webQsee to Chrome or Edge in one click. Recording and replay are free, no signup needed. Upgrade when you need AI analyses, cloud sharing, S3 storage and Pro-grade tooling.
Works in Chrome 103+, Edge 103+ and most Chromium-based browsers. Install instructions.