"It works on my machine"
Record it working and record it failing, then analyze both together. The question you are actually asking is what differs, and that is a question a single recording cannot answer at all.
Estimated time: 20 min · Last reviewed: 2026-08 · Difficulty: Medium
Available now in the browser, and in the extension this autumn.
The AI analysis, the three webQsee AI strengths, Deep Inspection and the new plans are live today in webQsee web at view.webqsee.com: open a recording there, analyse it, and buy a plan or a booster if you want one. The Chrome and Edge extensions are in review and follow this autumn. Your recordings, your gallery and your account are the same in both, so nothing you do now has to be done again.
Before you start
- The webQsee helper installed. Comparison is a Deep Inspection feature; the quick analysis reads one recording at a time by design
- Two or more recordings of the same flow, ideally captured the same way
Capture the pair well
The comparison is only as good as the pair. A few minutes here saves the analysis from finding differences that are about how you recorded rather than about the bug.
- Same flow, same steps. Walk through the same path in both, in the same order.
- Start before the interesting part in both. A recording that begins after the failure cannot be compared against one that begins before it.
- Same kind of recording. Two Behavior Reports compare better than a Behavior Report against an Event Snapshot, because one of them has no video timeline.
- Name them so you can tell them apart. "checkout ok" and "checkout 500" beats two timestamps.
Analyze them together
Two ways, and they do the same thing.
Select them in the gallery
Turn on selection mode, tick both recordings, and press AI analysis in the selection bar.
Or group them into a collection first
If it is a pair you will come back to, make a collection out of them. The collection card has its own Analyze action, and the whole collection is opened as one analysis: the recordings, and also the screenshots, videos, HTTP archives and Excel overviews in it, which the agent reads alongside them.
Sanity check: the sheet says how many items are about to be analyzed together, and the quick analysis is offered as disabled with the reason: it reads one recording at a time.Ask the comparison question
"The first one works and the second returns 500 at the payment step. What is different?"
Sanity check: the panel's coverage box names every recording in scope, not just the one you started from, and the agent's steps show it opening the workspace and running a comparison rather than reading one recording twice.
What it actually compares
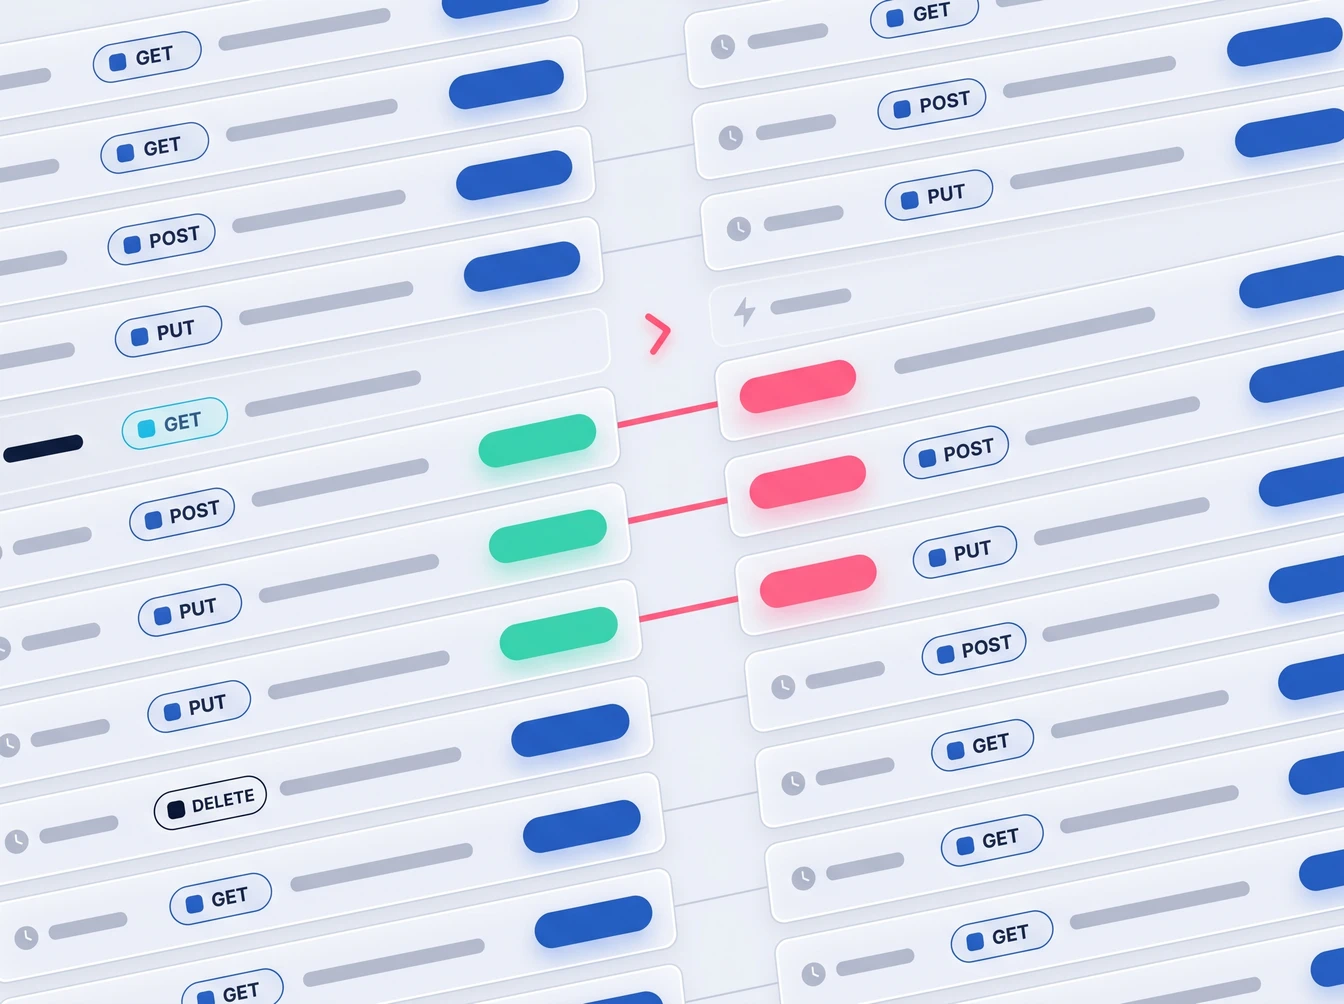
It does not print two overviews side by side and leave the reading to you. It matches across the recordings:
- Endpoints. Which ones only one recording called, and which ones both called with different outcomes. Cache-busted and id-bearing URLs are collapsed to a pattern first, so one endpoint hit a hundred times is one endpoint.
- Console errors. Matched by fingerprint rather than by exact text, so the same error with a different id in it is recognised as the same error.
- Environment. Browser, platform, viewport, language, whether the machine was offline.
- Page order. Which pages each recording visited, and in what order.
The caveats, and why they come first
A comparison result begins with notes rather than with tables, and that ordering is deliberate. A difference can mean much less than it looks, and the four notes say when:
- Different lengths. A recording that ran for 30 seconds and one that ran for five minutes will differ in ways that are about duration, not about the bug.
- Truncation. The recorder has ceilings. If one recording hit one and the other did not, "only in A" can mean "B stopped keeping them".
- Console history. Console lines from before the capture began are replayed into a recording, so a tab that had been open for days brings days of history with it.
- Different rule sets. A comparison compares readings. If the two recordings were read with different error-detection rules, their statuses are not comparable, and nothing stops you doing it.
Where the result is stored
An analysis of a collection is saved on the collection, with a record of what the collection contained when the analysis ran. A collection changes over time, so the saved analysis tells you when items have been added, removed or edited since, and offers to analyze the collection again as it is now.
A selection has no such home, so saving one offers to make a new collection of the analyzed items. You can also keep it with one of the recordings, or with each of them. Either way the saved analysis lists every item that took part, so it never looks like a single-recording analysis later, and each recording shows the collection analyses it took part in beside its own.
Next
Stop guessing. Start webQseeing.
Add webQsee to Chrome or Edge in one click. Recording and replay are free, no signup needed. Upgrade when you need AI analyses, cloud sharing, S3 storage and Pro-grade tooling.
Works in Chrome 103+, Edge 103+ and most Chromium-based browsers. Install instructions.